
In our previous blog posts, we discussed how the entrepreneur falls in love with an idea and then works with his own team as well as extended team members to come up with options and alternatives to solve a clearly defined problem. It also discussed how he could create models and prototypes that were then iterated to ensure that the finished product looks as close to what he believes will solve the problem and make the world a better place.
The ultimate objective of all this hard work is to create a product that people will love and use. It is this love and utility that the entrepreneur looks at monetising to ensure that he is able to add value to his team and to look at funding further iterations to make the product even more powerful, useful and economically viable.
For something to be economically viable, it is important that people in the target market first put money down to purchase and use the product. Without this target market, the entrepreneur’s dream is nothing more than a garage project. It needs to be marketed and monetised.
That’s where Market Opportunity Analysis (MOA) comes in.
Market Opportunity defined
The Oxford Dictionary defines Market Opportunity as a situation in which a product, service, etc. that is potentially wanted or needed by consumers is identified by a business as not being supplied by rival companies.
Market Opportunity is often quoted as the total size of a particular market. We see it all the time in business editions and newspapers as “The Market size for the new drug is USD XYZ Billion”, or “The startup aims to capture x% of the USD 100 Billion Dollar Market for ”.
Why should we ‘define the market opportunity’?
Whatever may be the plan for raising capital, the entrepreneur and his team need to know what the size of the market for their product is. Understanding this is also needed to show the entrepreneur and his team the ‘size of the prize’ and allowing them to chart courses and actions and strategies to work towards a clear financial goal. The MOA is a critical indicator of marketing success because it serves as an indicator to show the entrepreneur and his team how well they are able to capture the market.
Defining the MOA will become even more important when seeking funding from investors. It will be the first question that even family and friends will ask about when the entrepreneur asks them for money. If it is an investor, the entrepreneur can be sure that it will be required in the first 2 or 3 slides of the ‘pitch’. Not having this number will be a very big blow to the credibility of not only the slide deck/pitch but also to the credibility of the entrepreneur.
Special article : MOA in the post Covid World
We felt we must highlight this issue in our blog at this time. Everyone in every industry is either directly or indirectly affected by the earthquake-like effects of the Covid19 Pandemic. We say ‘earthquake-like’ because we are seeing and hearing the aftershocks that will impact businesses of all sizes for a very long time to come. The disruption in business and financial models have resulted in even established/safe players running for cover. Old assumptions relating to ‘safe’ industries and financial incomes have all been upended by the new and unpredictable aftershocks that Covid19 has brought with it. Entrepreneurs need to revisit their calculations on how their products and services will be impacted based on how their MOA has changed in the post covid world. For example, companies in the medical equipment field have seen a sudden upward demand for instruments like ventilators. Closer home, in Tiruppur, the textile manufacturing hub of India, firms are dealing with a fall in apparel demand but a huge opportunity in the USD 2 Bn PPE segment!
How to determine ‘Total Market Size’ or ‘Total Addressable Market’
There are several ways an entrepreneur and his team can collect data on the market size. Some of them are:
- Census and Labor Bureaus
- Industry associations and Confederations
- Government websites and regulatory agencies
- Analyst reports from Consulting firms
- Regulatory filings such as Annual Reports of competitors in the same industry
- Commissioning own research with experts/consultants
- Purchasing studies and reports from agencies
We would like to add here that no report should be taken completely at face value. Each fact and figure needs to be validated with others before a final decision is made on what ‘number’ will be identified. We say this because in the current day and age, facts are sometimes at a premium. Cross checking these facts will help the entrepreneur and his team sort the wheat from the chaff.
The Total Available Market
No business would be in a position to create a 100% market share of a particular industry. It would, however, aim to capture a percentage of the industry. Trying to approach a market, without first targeting niches, specific price points, customer cohort sizes or geographic areas for roll out, could result in very dangerous repercussions (if not outright failure) of the entrepreneur’s ambitions.
Factors to keep in consideration when ascertaining Total Addressable Market
We came across a great article on Forbes that lucidly states the 3 ways of approaching the total addressable market. You can read all about it here.
They are:
- Top-down, using industry research and reports.
- Bottom-up, using data from early selling efforts.
- Value theory, using conjecture about buyer willingness to pay.

One of the questions that entrepreneurs ask us frequently is : What is the difference between an Addressable Market and an Available Market.
We created this chart that we hope will clarify this question
Competition Research using the Solution Matrix
Competitors and competing products are a key factor to be considered when planning a foray into the market. The internet has created multiple opportunities for target audiences to look at alternatives. Both B2B as well as B2C audiences are all in the same quest for ‘better alternatives’.
The solution matrix provides the team with an easy to use system that allows them to identify and address not only areas where their product may be able to gain a strong foothold but also blind spots and gaps that they may not yet have identified
| Strategies | ||||||
| Adapt products & Processes | Remove market constrains | Leverage strengths of… | Combine resource & capabilities | Policy Dialogue | ||
| Constraints | Market Information |
|
|
|||
| Regulatory Environment |
|
|
||||
| Physical Infrastructure |
|
|||||
| Knowledge and Skills | ||||||
| Access to Financial Services | ||||||
THE BUSINESS MODEL CANVAS
The Business Model Canvas (BMC) helps an entrepreneur and his team get a clear picture of the way his business is organised. The BMC essentially looks at how value is created and captured, and how the company uses its tools, technologies and partnerships to generate revenues and drive down costs. Much has been written about the business model canvas, but we believe that there is a lot of utility to be found in this Canvas – especially in the way it studies customer segmentation and value propositions for these customer segments.
A Business Model Canvas is essentially a rectangle made up of 9 building blocks. Each of these blocks are arranged in a way that helps the user logically arrive at how the business generates revenue and how the businesses costs add up and how best to optimise the cost/revenue mix.

To give you a clear idea of what we are talking about, here is a great video that explains what a Business Model Canvas is, by its creator Alexander Osterwalder.
Why should an entrepreneur create a business model canvas?
- It shows her the entire scheme of things at a high level on one sheet of paper – something that other tools and systems do not do
- The BMC allows the entire company to understand what they are about and what each team can do to help the business succeed
- The BMC is a great way to showcase the abilities, strengths and weaknesses of the business to mentors for their advice and inputs
- The BMC is a handy tool for elevator pitches to investors and consultants.
- Periodic reviews of the BMC allows businesses to see where they are going wrong, what activities and components they can optimise or outsource
THE BUSINESS MODEL CANVAS IN DETAIL
The business model canvas components are listed with a brief description, below:
Box 1 : Customer segments
These are the customers who will ultimately use the product. This section needs to include all customers. There could be different segments of customers who use different parts and pieces of the product functionalities to meet their own unique needs. These ‘cohorts’ need to be listed out in this section
Box 2 : Value Proposition
The value proposition are the bundles of product features that help the customer ‘get what they want’. It also helps the entrepreneur understand what are the product features that help increase value as well as reduce pain points and challenges that customers might face before, during and after using the product.
Box 3 : Channels
Channels refer to the various touchpoints that are being set up to help the customer take advantage of the value proposition.
Box 4 : Customer Relationships
Customer relationships describe the kind of relationship that the business would like to have with their customers. To be more specific, this section deals with the form and format of the customer relationship methodology. Questions that could be asked relate to whether the interactions would be automated? Would it be personalised service? How do you get, keep and grow your customer base?
Box 5 : Revenue Streams
This section refers to how the business is capturing value from the customer and how effectively this is being monetised.
These first 5 boxes refer to the Front Stage. This section deals with the aspects of the business that customers see, touch and otherwise interact with. Look at boxes 1 to 4 are like levers that can be pulled to ensure optimum customer service and consequent revenue generation.
Box 6 : Key Resources
This box contains all the assets that the business uses to generate value for the customer. These could include IP, factories, logistics systems and human capital (amongst others) that are used to generate value for the customer.
Box 7 : Key activities
Key activities refers to all activities that are conducted by using the key resources to add value to the client. These could involve physical activities such as manufacturing, printing, publishing or even mental activities such as coding or creating and formalising IP that could then be monetised to generate customer value and even more revenues.
Box 8 : Key Partners
No business makes it alone. In the 21st century (and beyond), collaboration and working together in concert with all stakeholders will be a key driver for business success. In the Age of Outsourcing, it makes sense for companies to look at what are the non-key aspects of their business that they could outsource to other businesses for whom this activity is the main business. Doing this helps free up time and treasure for the business to look at pursuing what really matters. A classic example of this is the outsourcing of IT work by mobile phone companies to experts in the field of IT who manage the IT for them, while the mobile phone companies concentrate on the customer acquisition – a key metric for their success.
Boxes 5 to 8 refer to the Back Stage. This section deals with the aspects of the business that customers don’t see, touch and otherwise interact with. These actions are taken to ensure that the wheels of business roll, the right partnerships and alliances are made so that the customer is always presented the best products at the most opportune time
Box 9 : Cost Structure
This box captures what is the cost involved in executing boxes 6, 7 and 8.
It is a simple thumb rule of business that the revenues must always be equal to or higher than, the cost of doing business.
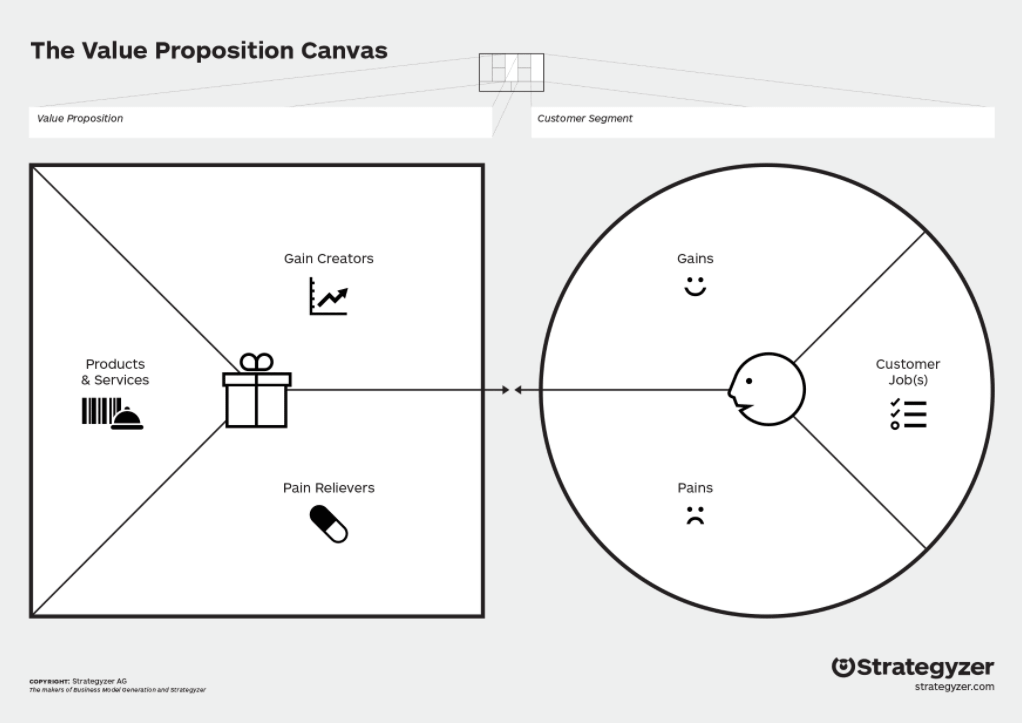
THE BUSINESS VALUE CANVAS OR THE VALUE PROPOSITION CANVAS
This is a version of the Business Model canvas. It consists of nine cells that define the different aspects of the business. The Business Value Canvas focuses on the ‘Customer Segment’ and the ‘Value Proposition’.
The difference here is that in the Business Value Canvas, the entrepreneur looks at how his product and service helps the customer ‘do her intended job’ with the product or service better, what are the ‘pains’ that the customer faces now and what are the ‘gains’ that can be achieved when using the product or service. The entrepreneur then looks at how the learnings from the Customer Segmentation study then translates to how the business moves to alleviate the pains, maximize the gains and help the customer do the ‘job’ more effectively.
The format looks like the sketch below
CUSTOMER SEGMENTS
We will focus on the Customer Segmentation piece first. This section feeds into the Business Model Canvas in the ‘Customer Segmentation’ box.
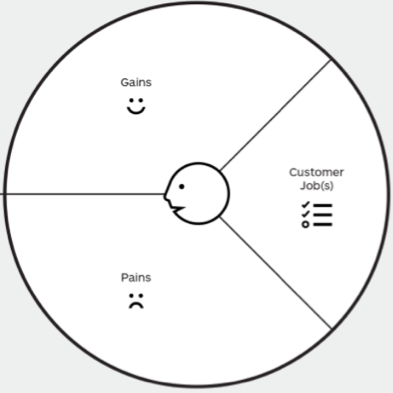
Factor 1: Jobs
These are the tasks/aims that the customer hopes to accomplish with this product
What are the ‘jobs to be done’ by a potential customer, when he looks at a product in the category you aim to address? These jobs need not be ‘functional’ alone. They could also be ‘emotional’.
Factor 2: Pains
This is an outcome the prospective customer wants to avoid. “What does she not want?”
What are the pains that the customer faces from doing the ‘jobs to be done’ well? What are the risks, obstacles and challenges that prevent them from using the product to ‘do a job’. What are the areas of interaction with the product that frustrates her? What are the reasons she would cite for not using the product?
Factor 3: Gains
This is an outcome the prospective customer wants to achieve. “What does she want?”
If they do the job well, what are the ‘gains’ or achievements that the potential customer can hope to enjoy?
While this can be clear in the mind of the entrepreneur and his core team, it needs to be crystallised into a shared understanding through a format that can be easily understood by all viewers. Teams in marketing, technology, sales and human resources all need to know what the product is about and what purpose it will serve – and then align their individual teams’ actions towards this common goal.

Team Exercise
How to arrive at a Customer Segmentation Chart that can be used to map the Value Proposition.
At the end of this 4 step process, you would have created a clear map that shows you and the team the Jobs, Pains and Gains for the users of the product.
What you will need : Post It ‘sticky note’ pads in three different colours, a room with a whiteboard or a large sheet of paper, pens and paper pads.
Step 1 : Create the Jobs, Pains and Gains chart on a whiteboard or a large sheet of paper. Simply draw a circle and divide it into 3 equal parts. In clockwise order, print “Jobs’, ‘Pains’ and ‘Gains’ in bold lettering. This will serve as the format for the rest of your whiteboard session
Step 2 : The team needs Post-it Pads of three colors. Using Post Its (separate colours for each segment), write down the different aspects of the jobs, pains and gains that you and the team have observed and experienced
Step 3 : Organise the rough collection of Post-It notes into columns and rows so that the team sees their inputs coming together
Step 4 : Brainstorm to come up with the top 3 Jobs, Pains and Gains that you and the team will work on.
This step serves as the launch pad to help you fill out the next phase of discussion : The Value Proposition Canvas
VALUE PROPOSITION
Once the customers jobs, pains and gains are defined and listed out, the next step is to understand what are the product features that help get the customers’ Job done, what are the Pain Alleviators and what are the Gain Creators
This step is critical because it now maps the customers to the product that is being developed. It shows what specific features of the product help do a job, what specific product feature/s helps alleviate the pain faced by the customer and what product features create value/gain for the customer. The entrepreneur and his team now make a map of how their product satisfies the market/customer need.
It means connecting the Customer Segment with the Value Proposition boxes. 2 of the 9 Boxes of the Business Model Canvas that define where the company brings in revenues
Product features
This segment lists out the various product features that help the customer segments ‘do their job’. Customers hire products to help them get something done. The product features section talks about how the product features help the customers get something done.
Pain Alleviators
These points are product features that help alleviate the customer’s pain points and challenges when using a product. The pain alleviators help make the product more palatable and more easily accessible to the consumer. Pain alleviators also need to be looked at in the context of the competitors – are their products able to do something better than the entrepreneur’s?
Gain Creators
These factors help the end user actually experience a great product. It involves finding how a product feature helps the customer positively.
We would also like to share some great resources on this topic with you. We have learnt a great deal while authoring this blog. We felt that not sharing the great work that has been done would be a grave injustice.
- A great video on YouTube where Alex Osterwalder– the author and inventor of the Business Model Canvas, a tool to visualize, challenge and reinvent business models – talks about his next book: Value Proposition Design.
- The Business Model Canvas